The control and visualization of wastewater and process water systems is a central component of automation technology. A clear and reliable display of the processes helps the operating personnel to maintain an overview of the system and control processes efficiently.
At ALMAWATECH, the software for control and visualization is developed in-house. This means that user interfaces and process displays can be individually adapted to the respective system and customer-specific requirements.
Table of contents
Structure of the visualization
A system visualization consists of several technical components that work together:
PLC control (PLC): Pumps, valves, blowers, agitators or dosing stations are automatically controlled and regulated via the programmable logic controller.
HMI/operator interface: We use Siemens Unified Comfort Panels for operation. These offer modern touch operation, high resolution and flexible options for displaying process images. Operating states such as flow rates, fill levels or pH values are displayed here in real time.
Alarm and message system: Deviations from target operation are displayed in the form of messages. This allows operators to react quickly.
Data recording: Process data is stored continuously and is available for evaluations or reports. Typical applications are daily and monthly reports, consumption data or evidence for authorities.
Interfaces: The systems can be connected to customer control systems or remote access solutions via standardized protocols such as OPC-UA or Modbus.
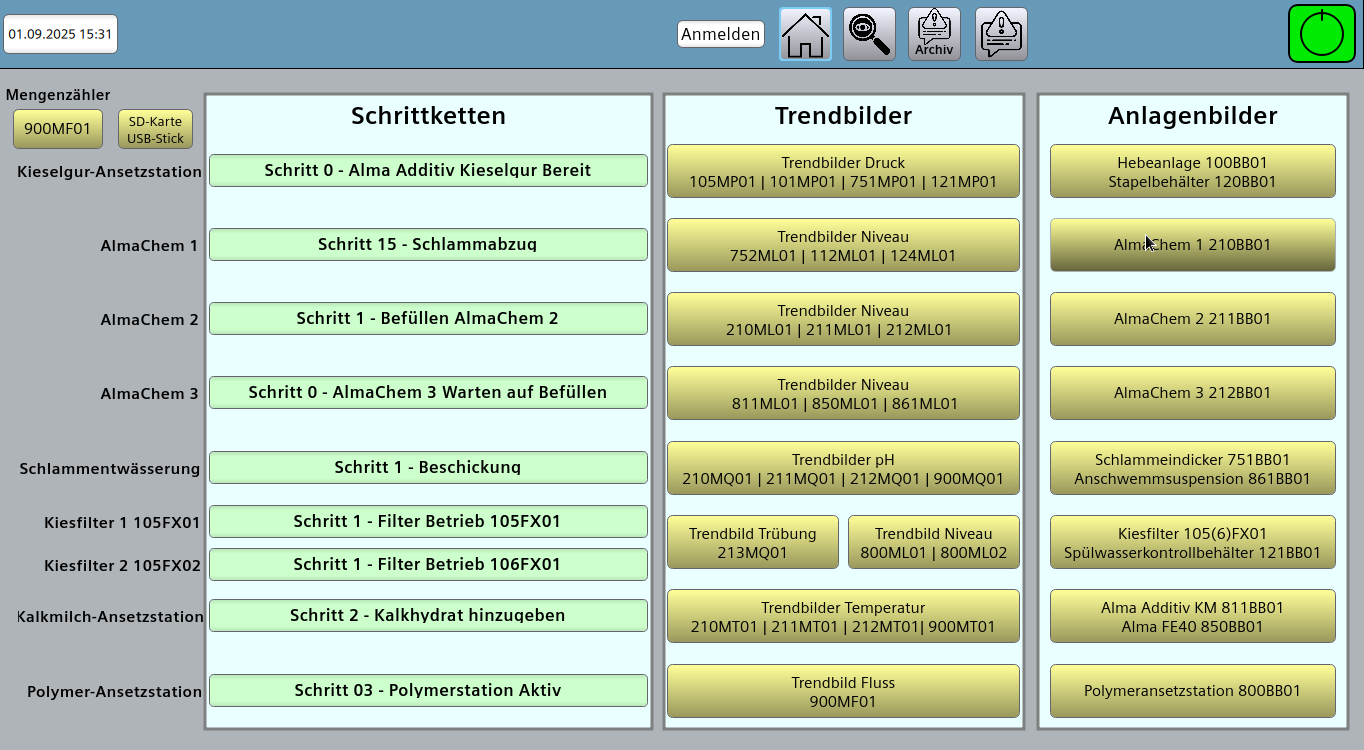
Photo: Overview page for quick access to the step chains, trend images and system images.
Advantages of a customized solution
As every wastewater or process water system has different framework conditions, it makes sense to adapt the visualization to the specific project. This includes, for example
the selection of the displayed measuring points and aggregates,
the structure of the user interface,
the definition of alarm and limit values,
and the design of report formats.
The result is a visualization that is based exactly on the real processes and remains easy to understand for the operating personnel.
Operation and user-friendliness
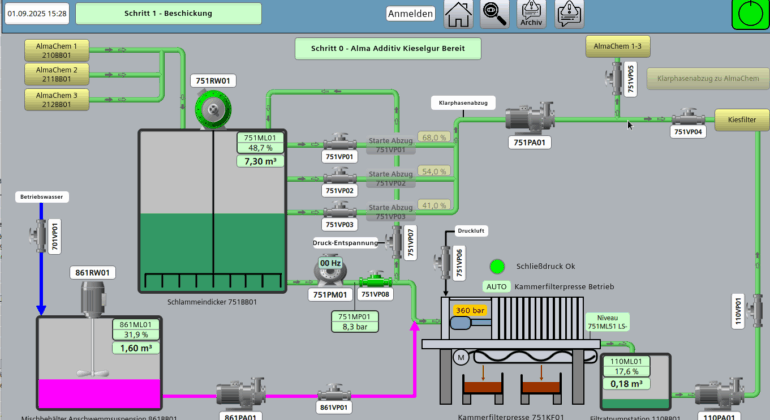
A key aspect when creating visualizations is clarity. Operators must be able to see at a glance whether the system is running stably or whether there is a need for action. This is why process screens are clearly structured and only the relevant parameters are displayed.
Typical representations are:
Tanks and containers with level indicator,
Pipes with flow measurement,
Pumps and valves with operating status (on/off, open/closed),
Online measured values such as pH, redox, conductivity or temperature.
This clear presentation makes day-to-day operation easier and potential faults can be classified more quickly.
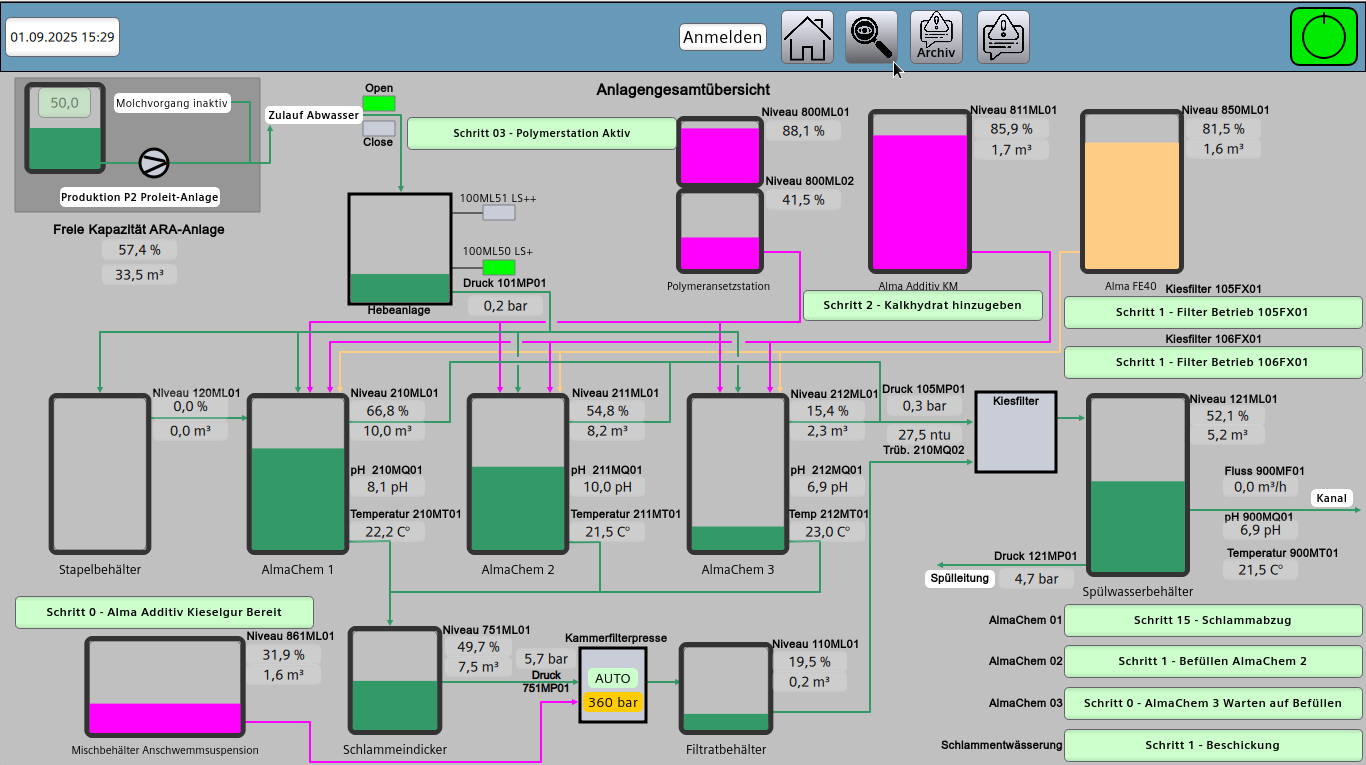
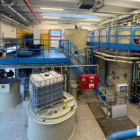
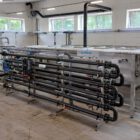
Photo: Overview display showing the installed reactors with their respective fill levels and interconnections.
Examples of recorded data
The system visualization provides a wide range of measurement and operating data, including
Inlet and outlet quantities,
Chemical consumption,
Sludge volumes and disposal quantities,
Energy consumption of fans or pumps,
Online analysis of nitrogen, phosphorus or COD.
This data is not only relevant for ongoing operations, but also forms the basis for official verifications or internal optimization measures.
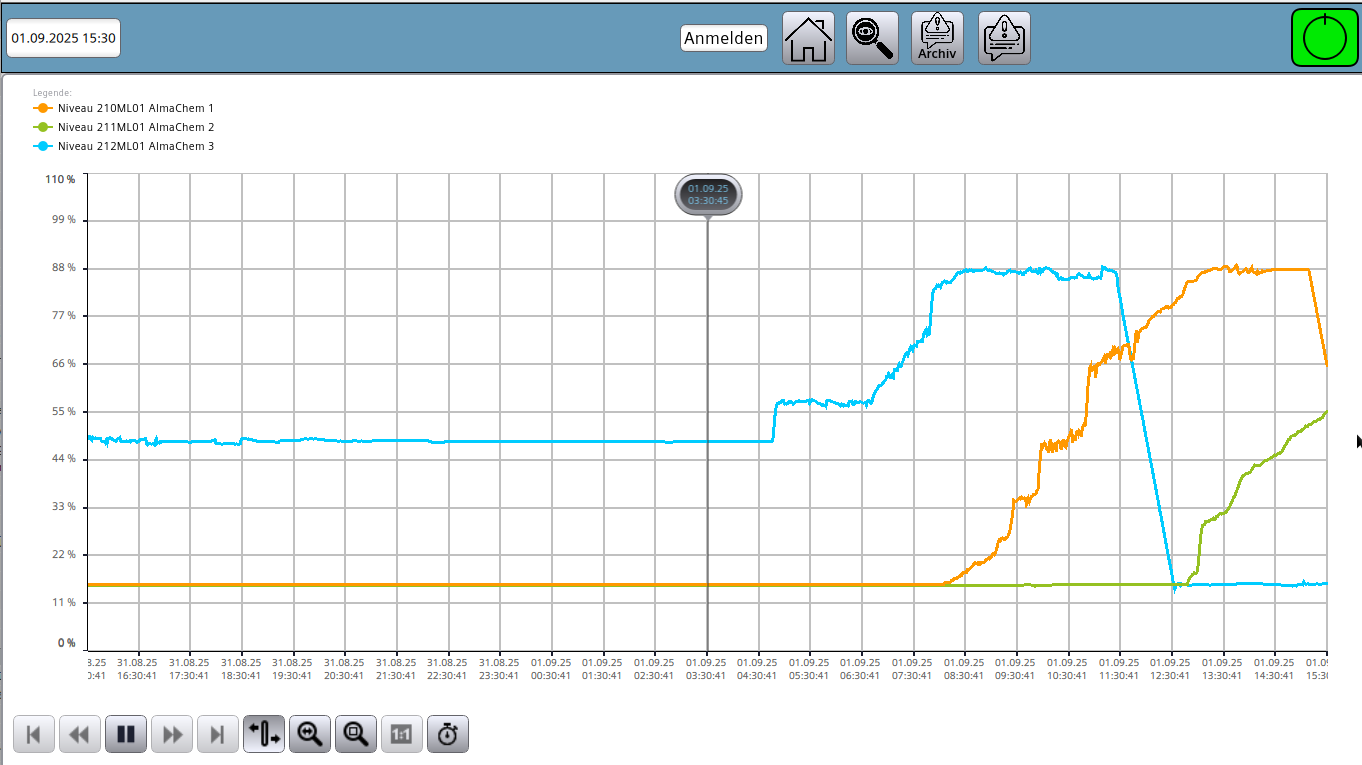
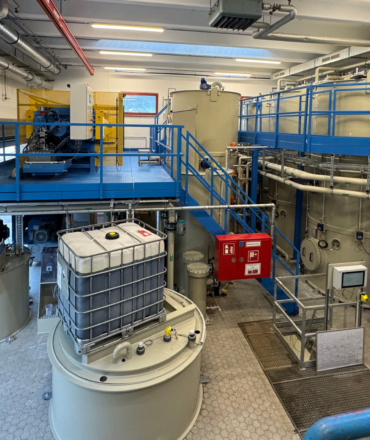
Photo: Representation of the levels in batch reactors 1 to 3 (system: CP system ALMA CHEM MCW)
Summary
The visualization and control of wastewater and process water systems includes the areas of PLC, HMI, alarm management, data recording and interface integration. Thanks to the in-house development of the software at ALMAWATECH and the use of Siemens Unified Comfort Panels, visualizations can be adapted to specific projects. This enables a transparent representation of the operating processes and supports efficient and safe plant management.